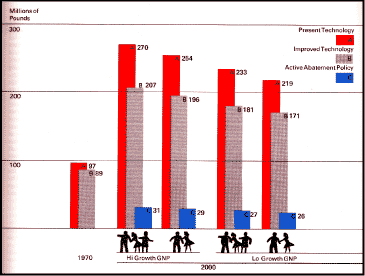
The bars labeled A, shown for background purposes only, indicate the levels of hydrocarbon wastes that would be generated under present technology: These waste levels would be generated if there were no changes in technology between the 1967-1970 base period and the year 2000.
The bars labeled B show actual emissions of hydrocarbon pollutants in 1970 and expected emissions in the year 2000, assuming no change in pollution abatement policy. The difference between A and B shows the extent to which the introduction of more efficient, less wasteful technology between now and the year 2000 is expected to reduce the generation and emission of pollutants below the levels generated if technology remained unchanged. Such changes in technology are likely to come anyway; they do not depend on public pressure to reduce harmful residuals.
The B bars show that, even with improved technology, pollution levels would be much higher in the year 2000 than they are now. These levels would, however, be somewhat lower if population grew at the 2-child rate rather than the 3-child rate, and if the economy grew at a slower rate rather than a more rapid rate (lo-growth GNP vs. hi-growth GNP).
The bars labeled C show hydrocarbon emissions in the year 2000 assuming an active pollution-abatement policy. The assumed policy is the Environmental Protection Agency's 1975 standard for emissions into the air. The changes in production and waste treatment processes induced by this policy would have a greater effect than would any of the other changes shown-in technology, population growth, or economic growth.
Source: Ronald G. Ridker, "The Economy, Resource Requirements, and Pollution Levels" (prepared for the Commission, 1972).